Hi all
Just made (another) fresh install to try solving this issue but unfortunately did not work and still not having an idea.
This configuration worked fine before, then I had to move the server and the issue started.
No changes on test device, no changes on gateway.
First time I had launched the device, it worked fine, all frames, uplinks seemed ok.
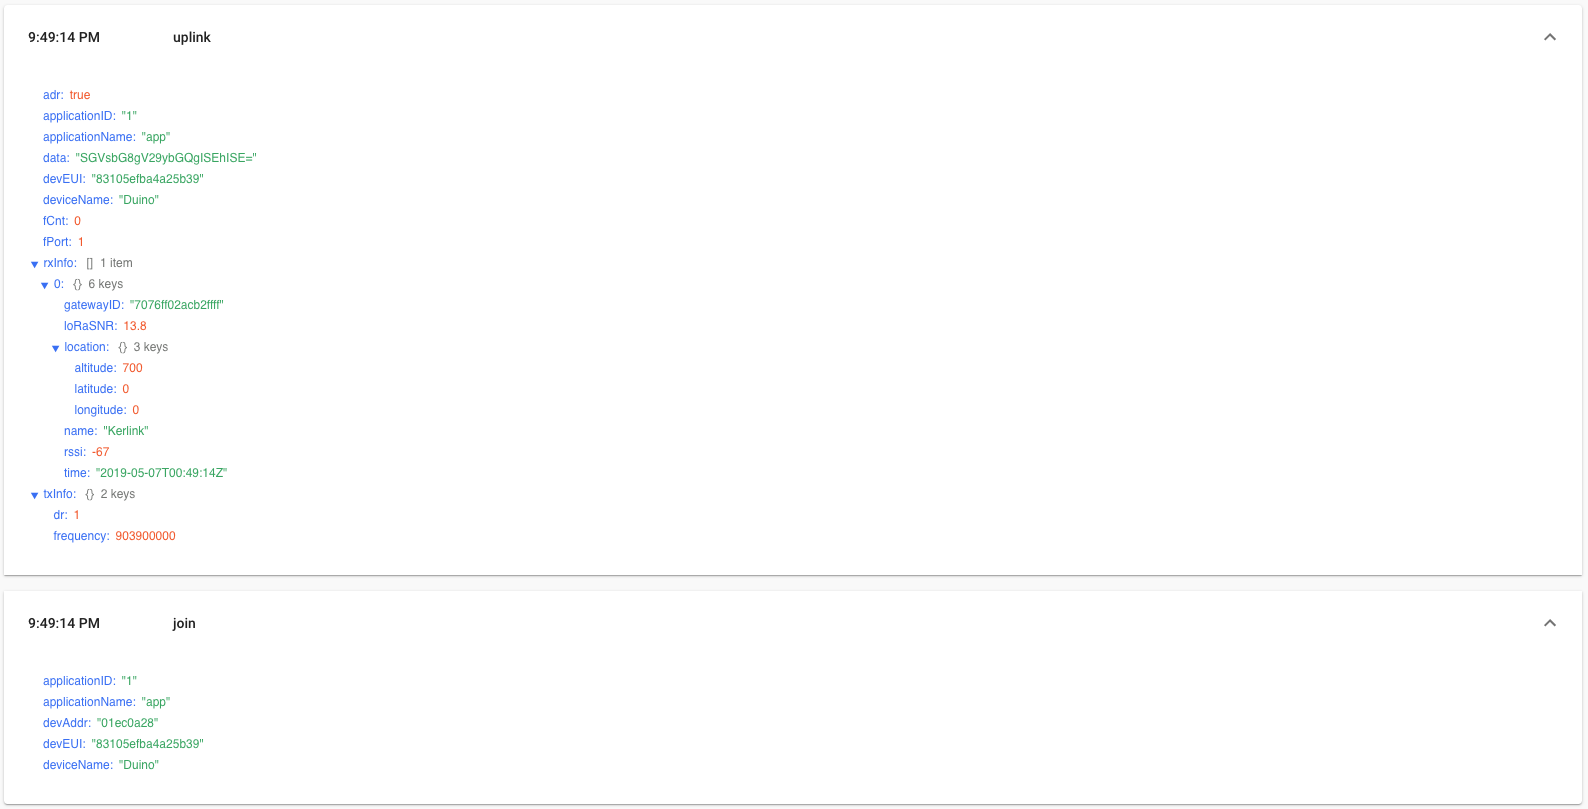
After a hard reset on the device, after the join, only join and one uplink were received.
My MQTT looks like:
ubuntu@ip-172-31-21-8:~$ mosquitto_sub -h localhost -t application/1/#
{“applicationID”:“1”,“applicationName”:“app”,“deviceName”:“Duino”,“devEUI”:“83105efba4a25b39”,“devAddr”:“01ec0a28”}
{“applicationID”:“1”,“applicationName”:“app”,“deviceName”:“Duino”,“devEUI”:“83105efba4a25b39”,“rxInfo”:[{“gatewayID”:“7076ff02acb2ffff”,“name”:“Kerlink”,“time”:“2019-05-07T00:49:14Z”,“rssi”:-67,“loRaSNR”:13.8,“location”:{“latitude”:0,“longitude”:0,“altitude”:700}}],“txInfo”:{“frequency”:903900000,“dr”:1},“adr”:true,“fCnt”:0,“fPort”:1,“data”:“SGVsbG8gV29ybGQgISEhISE=”}
My gateway doesn’t use bridge
My Gateway Bridge logs:
May 07 01:01:21 ip-172-31-21-8 lora-gateway-bridge[866]: time=“2019-05-07T01:01:21Z” level=info msg=“gateway: stat packet received” addr=“177.94.216.244:47480” mac=7076ff02acb2ffff
May 07 01:01:21 ip-172-31-21-8 lora-gateway-bridge[866]: time=“2019-05-07T01:01:21Z” level=info msg=“backend: publishing packet” qos=0 topic=gateway/7076ff02acb2ffff/stats
May 07 01:01:21 ip-172-31-21-8 lora-gateway-bridge[866]: time=“2019-05-07T01:01:21Z” level=info msg=“backend: config packet received” topic=gateway/7076ff02acb2ffff/config
May 07 01:01:21 ip-172-31-21-8 lora-gateway-bridge[866]: time=“2019-05-07T01:01:21Z” level=warning msg=“gateway: configuration was not applied, gateway is not configured for managed configuration” mac=7076ff02acb2ffff
This is level 5 gateway debug:
May 07 02:38:28 ip-172-31-21-8 lora-gateway-bridge[2745]: time=“2019-05-07T02:38:28Z” level=debug msg=“gateway: cleanup gateway registry”
May 07 02:38:28 ip-172-31-21-8 lora-gateway-bridge[2745]: time=“2019-05-07T02:38:28Z” level=debug msg=“gateway: received udp packet from gateway” addr=“177.94.216.244:13322” protocol_version=2 type=PushData
May 07 02:38:28 ip-172-31-21-8 lora-gateway-bridge[2745]: time=“2019-05-07T02:38:28Z” level=info msg=“mqtt: publishing message” qos=0 topic=gateway/7076ff02acb2ffff/stats
May 07 02:38:28 ip-172-31-21-8 lora-gateway-bridge[2745]: time=“2019-05-07T02:38:28Z” level=debug msg=“gateway: sending udp packet to gateway” addr=“177.94.216.244:13322” protocol_version=2 type=PushACK
May 07 02:38:28 ip-172-31-21-8 lora-gateway-bridge[2745]: time=“2019-05-07T02:38:28Z” level=info msg=“mqtt: gateway configuration received” topic=gateway/7076ff02acb2ffff/config
May 07 02:38:28 ip-172-31-21-8 lora-gateway-bridge[2745]: time=“2019-05-07T02:38:28Z” level=error msg=“apply packet-forwarder configuration error” error=“gateway does not exist”
Note the last line:
May 07 02:38:28 ip-172-31-21-8 lora-gateway-bridge[2745]: time=“2019-05-07T02:38:28Z” level=error msg=“apply packet-forwarder configuration error” error=“gateway does not exist”
My loraserver:
May 07 01:02:51 ip-172-31-21-8 loraserver[821]: time=“2019-05-07T01:02:51Z” level=info msg=“gateway/mqtt: gateway stats packet received” gateway_id=7076ff02acb2ffff
May 07 01:02:51 ip-172-31-21-8 loraserver[821]: time=“2019-05-07T01:02:51Z” level=info msg=“gateway updated” gateway_id=7076ff02acb2ffff
May 07 01:02:51 ip-172-31-21-8 loraserver[821]: time=“2019-05-07T01:02:51Z” level=info msg=“gateway/mqtt: publishing gateway configuration” qos=0 topic=gateway/7076ff02acb2ffff/config
May 07 01:02:51 ip-172-31-21-8 loraserver[821]: time=“2019-05-07T01:02:51Z” level=info msg=“metrics saved” aggregation=“[MINUTE HOUR DAY MONTH]” name=“gw:7076ff02acb2ffff”
And my lora app server:
May 07 00:48:33 ip-172-31-21-8 lora-app-server[879]: time=“2019-05-07T00:48:33Z” level=info msg=“finished unary call with code OK” grpc.code=OK grpc.method=Get grpc.service=api.OrganizationService grpc.start_time=“2019-05-07T00:48:33Z” grpc.time_ms=2.896 peer.address=“127.0.0.1:40976” span.kind=server system=grpc
May 07 00:48:57 ip-172-31-21-8 lora-app-server[879]: time=“2019-05-07T00:48:57Z” level=info msg=“js: request received” message_type=JoinReq receiver_id=0000000000000000 sender_id=000000 transaction_id=3002410996
May 07 00:48:57 ip-172-31-21-8 lora-app-server[879]: time=“2019-05-07T00:48:57Z” level=info msg=“device-keys updated” dev_eui=83105efba4a25b39
May 07 00:48:57 ip-172-31-21-8 lora-app-server[879]: time=“2019-05-07T00:48:57Z” level=info msg=“js: sending response” message_type=JoinAns receiver_id=000000 result_code=Success sender_id=0000000000000000 transaction_id=3002410996
May 07 00:49:09 ip-172-31-21-8 lora-app-server[879]: time=“2019-05-07T00:49:09Z” level=info msg=“js: request received” message_type=JoinReq receiver_id=0000000000000000 sender_id=000000 transaction_id=2877428260
May 07 00:49:09 ip-172-31-21-8 lora-app-server[879]: time=“2019-05-07T00:49:09Z” level=info msg=“device-keys updated” dev_eui=83105efba4a25b39
May 07 00:49:09 ip-172-31-21-8 lora-app-server[879]: time=“2019-05-07T00:49:09Z” level=info msg=“js: sending response” message_type=JoinAns receiver_id=000000 result_code=Success sender_id=0000000000000000 transaction_id=2877428260
May 07 00:49:14 ip-172-31-21-8 lora-app-server[879]: time=“2019-05-07T00:49:14Z” level=info msg=“device updated” dev_eui=83105efba4a25b39
May 07 00:49:14 ip-172-31-21-8 lora-app-server[879]: time=“2019-05-07T00:49:14Z” level=info msg=“device-activation created” dev_eui=83105efba4a25b39 id=2
May 07 00:49:14 ip-172-31-21-8 lora-app-server[879]: time=“2019-05-07T00:49:14Z” level=info msg=“integration/mqtt: publishing message” qos=0 topic=application/1/device/83105efba4a25b39/join
May 07 00:49:14 ip-172-31-21-8 lora-app-server[879]: time=“2019-05-07T00:49:14Z” level=info msg=“finished unary call with code OK” grpc.code=OK grpc.method=HandleUplinkData grpc.request.deadline=“2019-05-07T00:49:15Z” grpc.service=as.ApplicationServerService grpc.start_time=“2019-05-07T00:49:14Z” grpc.time_ms=8.65 peer.address=“127.0.0.1:42726” span.kind=server system=grpc
May 07 00:49:14 ip-172-31-21-8 lora-app-server[879]: time=“2019-05-07T00:49:14Z” level=info msg=“integration/mqtt: publishing message” qos=0 topic=application/1/device/83105efba4a25b39/rx
May 07 00:51:32 ip-172-31-21-8 lora-app-server[879]: time=“2019-05-07T00:51:32Z” level=info msg=“finished unary call with code OK” grpc.code=OK grpc.method=Login grpc.service=api.InternalService grpc.start_time=“2019-05-07T00:51:32Z” grpc.time_ms=147.21 peer.address=“127.0.0.1:40970” span.kind=server system=grpc
May 07 00:51:41 ip-172-31-21-8 lora-app-server[879]: time=“2019-05-07T00:51:41Z” level=info msg=“finished unary call with code OK” grpc.code=OK grpc.method=Login grpc.service=api.InternalService grpc.start_time=“2019-05-07T00:51:41Z” grpc.time_ms=150.464 peer.address=“127.0.0.1:40970” span.kind=server system=grpc
and all the 3 repeats same log information from time to time.
The device still running, sending a fixed payload every each 10 seconds but nothing come to application server nor MQTT.
If it can be helpful, I’m using a Kerlink iFemtoCell and the led that indicates lora communication doesn’t blink anymore. Only when the device makes the join.
This is my config topic during JOIN:
ubuntu@ip-172-31-21-8:~$ mosquitto_sub -h localhost -t gateway/7076ff02acb2ffff/config
{“mac”:“7076ff02acb2ffff”,“version”:“2019-05-07T00:40:02.235976Z”,“channels”:[{“modulation”:“LORA”,“frequency”:902300000,“bandwidth”:125,“spreadingFactors”:[7,8,9,10]},{“modulation”:“LORA”,“frequency”:902500000,“bandwidth”:125,“spreadingFactors”:[7,8,9,10]},{“modulation”:“LORA”,“frequency”:902700000,“bandwidth”:125,“spreadingFactors”:[7,8,9,10]},{“modulation”:“LORA”,“frequency”:902900000,“bandwidth”:125,“spreadingFactors”:[7,8,9,10]},{“modulation”:“LORA”,“frequency”:903100000,“bandwidth”:125,“spreadingFactors”:[7,8,9,10]},{“modulation”:“LORA”,“frequency”:903300000,“bandwidth”:125,“spreadingFactors”:[7,8,9,10]},{“modulation”:“LORA”,“frequency”:903500000,“bandwidth”:125,“spreadingFactors”:[7,8,9,10]},{“modulation”:“LORA”,“frequency”:903700000,“bandwidth”:125,“spreadingFactors”:[7,8,9,10]}]}
If I connect the gateway to TTN, it receives all uplinks, every each 10 seconds.
EDIT 1
Just reinstalled following line by line from Quickstart guide and got exactly same behaviour.
Thank you for any help
