Hello,
We’re trying to make our own LoRa infrastructure with LoRa Server.
We have a Debian server which has LoRa Gateway Bridge - LoRa Server - LoRa App Server.
The “gateway” is a Raspberry Pi with a Dragino HAT and the Dual Channel Packet Forwarder from Dragino too.
Our nodes are ASCOEL CM868LR and CM868LRTH.
LoRa App Server : version 3.0.0
LoRa Server : version 3.0.1
Mosquitto : 3.1.1
LoRa Gateway Bridge : 3.0.1
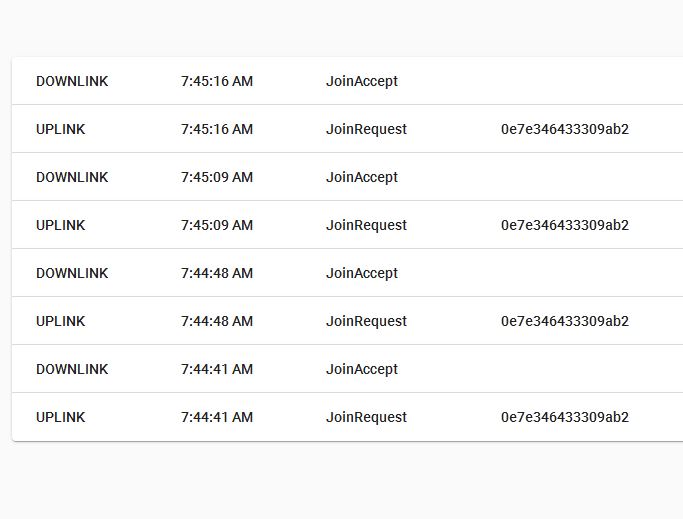
We’re stuck on tthe Join/Accept loop.
The way Node → App Server seems to work. But there’s something wrong with the Gateway Bridge → Gateway/Node.
All seems fine until the Gateway bridge → Dragino/Pi communication.

As you can see, there’s no frames transmitted.
Here’s a snippet from the mosquitto log
gateway/b827ebffffb96de6/event/up {"phyPayload":"AKqqqgAAAQAAspowM2Q0fg7Dx1yp/7k=","txInfo":{"frequency":868100000,"modulation":"LORA","loRaModulationInfo":{"bandwidth":125,"spreadingFactor":7,"codeRate":"4/5","polarizationInversion":false}},"rxInfo":{"gatewayID":"uCfr//+5beY=","time":null,"timeSinceGPSEpoch":null,"rssi":-44,"loRaSNR":9,"channel":0,"rfChain":0,"board":0,"antenna":0,"location":null,"fineTimestampType":"NONE","context":"0aqPnA=="}}
This one is the UPLINLK JoinRequest, followed immediately by the DOWNLINK JoinAccept
gateway/b827ebffffb96de6/command/down {"phyPayload":"IGHjXaDmfO3vReny/rTtoG2RvoPA52x+Y94EGoBdcLQV","txInfo":{"gatewayID":"uCfr//+5beY=","frequency":868100000,"power":14,"modulation":"LORA","loRaModulationInfo":{"bandwidth":125,"spreadingFactor":7,"codeRate":"4/5","polarizationInversion":true},"board":0,"antenna":0,"timing":"DELAY","delayTimingInfo":{"delay":"5s"},"context":"0aqPnA=="},"token":11015}
And a STATS request, immediately after.
gateway/b827ebffffb96de6/event/stats {"gatewayID":"uCfr//+5beY=","ip":"172.30.3.49","time":"2019-09-02T14:31:05Z","location":{"latitude":0,"longitude":0,"altitude":0,"source":"GPS","accuracy":0},"configVersion":"","rxPacketsReceived":1,"rxPacketsReceivedOK":1,"txPacketsReceived":0,"txPacketsEmitted":0,"metaData":{}}
At the same time, on the Gateway Bridge :
Sep 02 16:30:51 srv-lorawan lora-gateway-bridge[50799]: time="2019-09-02T16:30:51+02:00" level=debug msg="backend/semtechudp: received udp packet from gateway" addr="172.30.3.49:42759" protocol_version=1 type=PushData
Sep 02 16:30:51 srv-lorawan lora-gateway-bridge[50799]: time="2019-09-02T16:30:51+02:00" level=info msg="integration/mqtt: publishing event" event=up qos=0 topic=gateway/b827ebffffb96de6/event/up
Sep 02 16:30:51 srv-lorawan lora-gateway-bridge[50799]: time="2019-09-02T16:30:51+02:00" level=debug msg="backend/semtechudp: sending udp packet to gateway" addr="172.30.3.49:42759" protocol_version=1 type=PushACK
Sep 02 16:31:04 srv-lorawan lora-gateway-bridge[50799]: time="2019-09-02T16:31:04+02:00" level=debug msg="backend/semtechudp: received udp packet from gateway" addr="172.30.3.49:42759" protocol_version=1 type=PushData
Sep 02 16:31:04 srv-lorawan lora-gateway-bridge[50799]: time="2019-09-02T16:31:04+02:00" level=info msg="integration/mqtt: publishing event" event=stats qos=0 topic=gateway/b827ebffffb96de6/event/stats
Sep 02 16:31:04 srv-lorawan lora-gateway-bridge[50799]: time="2019-09-02T16:31:04+02:00" level=debug msg="backend/semtechudp: sending udp packet to gateway" addr="172.30.3.49:42759" protocol_version=1 type=PushACK
There’s an UP event, but no DOWN… It’s the STATS after.
Where should we look for finding what happens to the DOWN instruction ?
